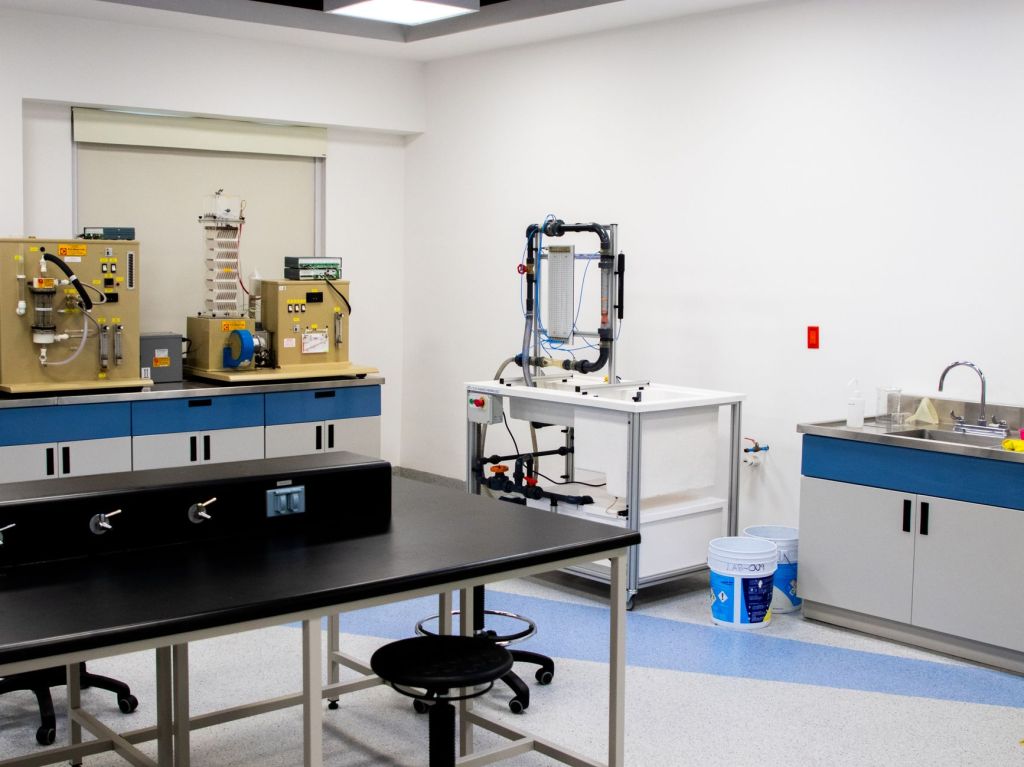

The field observations made during a ground investigation — the borehole logs, the in-situ test results, the groundwater levels — provide a qualitative and semi-quantitative picture of the ground. But the numerical parameters needed for geotechnical design — strength, stiffness, compressibility, permeability, classification indices — must come from the laboratory. Laboratory testing transforms the raw material of the investigation into the engineering data that designers need, and the quality of the design is therefore directly dependent on the quality and appropriateness of the laboratory testing programme. Understanding what each test measures, what it tells us, and what its limitations are is essential knowledge for geotechnical engineers and engineering geologists at every level of experience.
Laboratory tests on soils and rocks are carried out in accordance with British Standards — principally BS 1377 for soils and BS EN ISO 17892 for European harmonisation — and the results must be interpreted with a clear understanding of the conditions under which the tests are performed and how they relate to conditions in the ground. No laboratory test perfectly replicates in-situ conditions: samples are disturbed during recovery, they experience stress relief and moisture redistribution during transport and storage, and the boundary conditions in the test apparatus are a simplification of the complex three-dimensional stress states that exist in the ground. Good laboratory interpretation requires an understanding of these limitations and an ability to make sensible engineering judgements about the relevance of test results to design conditions.
Moisture Content
Moisture content — more precisely, water content — is one of the simplest and most fundamental laboratory tests in geotechnical engineering. It is defined as the ratio of the mass of water in a soil sample to the mass of the dry solid particles, expressed as a percentage. The test is carried out by weighing the sample, drying it in an oven at 105°C until constant mass is achieved, and re-weighing to determine the mass of water lost. The calculation is straightforward: moisture content = (mass of water / mass of dry soil) × 100%.
Despite its simplicity, moisture content is one of the most informative and widely used pieces of geotechnical data. For fine-grained soils, moisture content provides an immediate indication of consistency: a clay with a moisture content close to its liquid limit is soft or very soft, while one with a moisture content well below its plastic limit is stiff or very stiff. Moisture content values relative to the Atterberg limits (the liquidity index) allow direct comparison of the current state of the soil with its engineering behaviour limits. In earthworks and fill placement, moisture content relative to optimum moisture content controls the achievable compaction density. For organic soils, moisture content can reach several hundred percent of the dry mass, reflecting the enormous water-holding capacity of peat and organic materials. Moisture content is cheap, quick, and almost universally performed on all samples from a ground investigation.
Particle Size Distribution
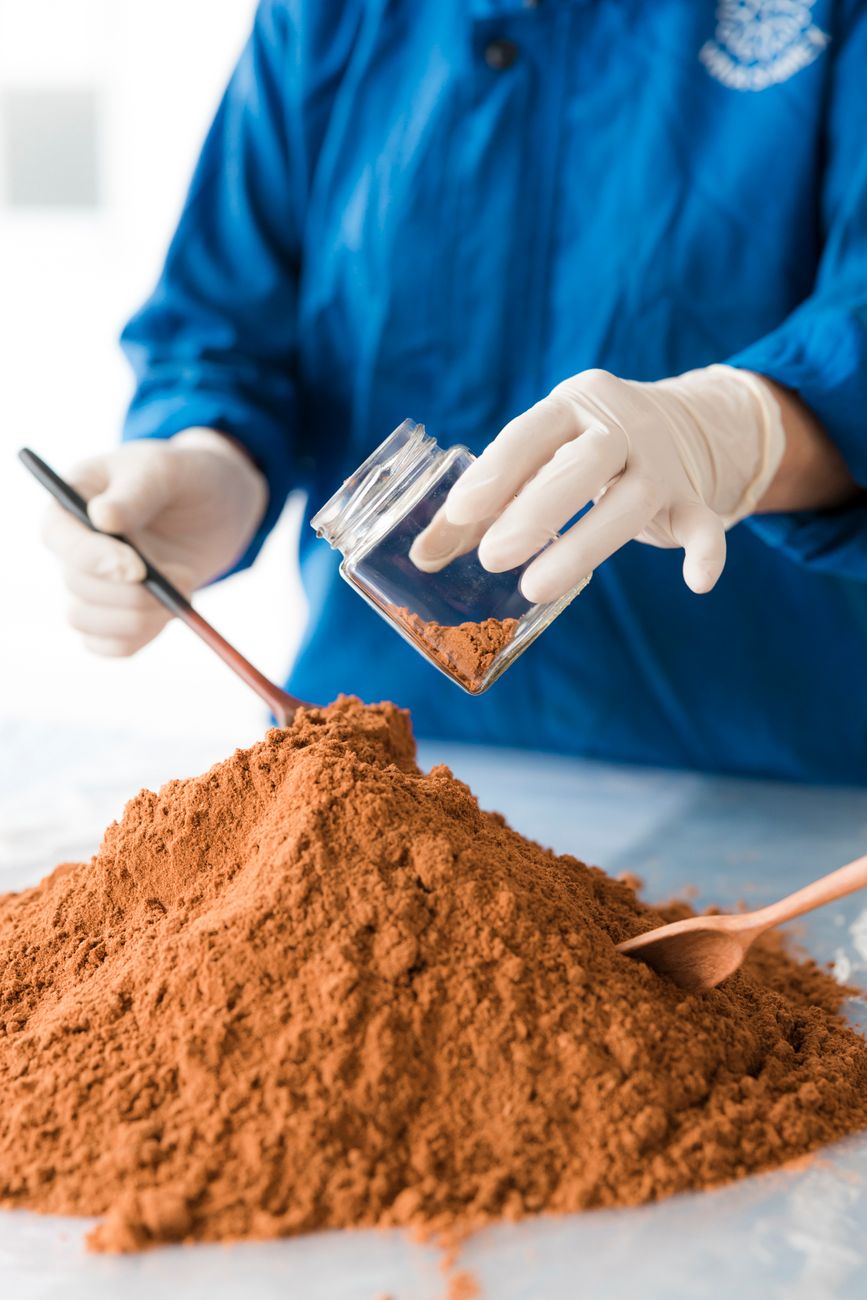
Particle size distribution (PSD) testing — also known as grading or gradation analysis — determines the distribution of particle sizes within a soil sample, and is the primary basis for soil classification. For coarse-grained soils (sands and gravels), the test is performed by sieve analysis: a dry soil sample is passed through a series of sieves of decreasing mesh size, and the mass retained on each sieve is measured and expressed as a percentage of the total sample mass. The results are plotted on a grading curve, with particle size on the horizontal axis (on a logarithmic scale) and percentage passing on the vertical axis.
For fine-grained soils (silts and clays), the particles are too small to be separated by sieving, and the hydrometer test or sedimentation method is used instead. This test exploits the fact that larger particles settle through a liquid more rapidly than smaller ones, in accordance with Stokes’ Law. A soil-water suspension is prepared and the change in density with time is measured using a hydrometer, from which the particle size distribution of the fine fraction is calculated. In practice, many soils contain both coarse and fine particles, and both sieve analysis and hydrometer testing are required to characterise the full grading curve.
The shape of the grading curve conveys important engineering information. A well-graded soil — one with particles distributed across a wide range of sizes — is typically denser, stronger, and less permeable than a poorly graded (uniform) soil of the same dominant particle size. The grading characteristics are summarised by coefficients of uniformity (Cu = D60/D10) and curvature (Cc = D30²/(D10×D60)), which are used in soil classification to distinguish well-graded from poorly graded materials. PSD data are also used to estimate permeability, assess frost susceptibility, specify fill materials, and design filter and drainage layers.
Atterberg Limits
The Atterberg limits — named after the Swedish agricultural scientist Albert Atterberg, who developed the original test methods in the early twentieth century — describe the moisture content boundaries between different consistency states in fine-grained soils. The two limits used in standard geotechnical practice are the liquid limit (LL) and the plastic limit (PL). The liquid limit is the moisture content at which a soil transitions from the plastic to the liquid state — it is determined by the Casagrande cup method or the cone penetrometer method (the latter being more commonly used in the UK). The plastic limit is the moisture content at which the soil can just be rolled into a 3 mm thread without cracking — below this moisture content, the soil behaves as a brittle solid.
The difference between the liquid limit and the plastic limit is the plasticity index (PI = LL – PL), which represents the range of moisture content over which the soil behaves plastically. High plasticity index values indicate a soil with a large range of plastic behaviour — typically a montmorillonite-dominated clay with high water-holding capacity and significant volume change potential. Low plasticity index values indicate a soil with limited plasticity — typically a kaolinite clay or a silty soil. The Atterberg limits are used to classify fine-grained soils on the Casagrande plasticity chart (plotting PI against LL), where the A-line separates clays (above the line) from silts (below the line), and the classification letters — CL, CI, CH, ML, MH — describe the soil type and plasticity class.
The Atterberg limits also provide direct correlations to engineering properties. The liquid limit correlates with compressibility — soils with high liquid limits are generally more compressible. The plasticity index correlates with undrained shear strength at a given liquidity index, with swelling potential, with the activity (PI divided by clay fraction, reflecting clay mineralogy), and with the angle of internal friction for drained behaviour. Atterberg limits are inexpensive, rapid, and routinely performed on fine-grained samples from ground investigations, and they provide a wealth of geotechnical information from a relatively simple suite of tests.

Shear Box
The shear box (or direct shear) test is one of the oldest and most widely used laboratory tests for measuring the shear strength of soils. A square or circular soil specimen is placed in a two-part box, consolidated under a normal stress, and then sheared by displacing the upper half of the box horizontally relative to the lower half at a controlled rate. The shear force required to maintain displacement is measured, and the peak and residual shear stresses are determined at a series of normal stress levels. By plotting shear stress against normal stress at failure for different normal loads, the failure envelope is defined, from which the Mohr-Coulomb strength parameters — cohesion (c’) and angle of internal friction (phi’) — are determined.
The shear box test measures drained shear strength directly, provided the test is carried out slowly enough for drainage to occur throughout the specimen. This makes it well suited to the measurement of drained parameters for granular soils and overconsolidated clays, and particularly to the measurement of residual strength — the strength of a soil on a pre-existing failure surface, where the clay particles have been oriented parallel to the direction of shearing and the strength has fallen to its minimum value. The residual shear strength is critical for the stability assessment of natural slopes that have already experienced movement and for the analysis of old landslides. The ring shear apparatus, which can displace specimens by unlimited amounts, is used to measure residual strength more reliably than the conventional shear box, which is limited to small displacements.
Triaxial
The triaxial compression test is the most versatile and widely used test for measuring the shear strength of soils. A cylindrical soil specimen is enclosed in a rubber membrane and subjected to an all-round confining pressure (the cell pressure), and then loaded axially to failure by increasing the vertical stress whilst maintaining the cell pressure constant. The test can be carried out under three different drainage and loading conditions: Unconsolidated Undrained (UU), Consolidated Undrained (CU), and Consolidated Drained (CD), each of which provides different strength parameters relevant to different design situations.
The UU test is the simplest and most rapid: the specimen is not allowed to consolidate under the cell pressure before shearing, and drainage is prevented during shearing. It provides the undrained shear strength (su) directly, which is relevant to short-term stability calculations for saturated clays — foundation bearing capacity, slope stability during rapid construction, and retaining wall design in clays. The CU test consolidates the specimen under the cell pressure before shearing undrained, and with the addition of pore pressure measurement, provides both the total stress and effective stress failure envelopes. The CD test fully drains the specimen during shearing, providing the drained effective stress parameters (c’ and phi’) that govern long-term behaviour. The triaxial test provides better control of drainage conditions and stress states than the shear box, and is the standard test for determining strength parameters for design in the UK.
Oedometer
The oedometer test — also known as the one-dimensional consolidation test or the consolidation test — measures the compressibility and consolidation characteristics of fine-grained soils. A circular disc of soil is placed in a steel ring that prevents lateral expansion and loaded incrementally with vertical stress, typically doubling the stress at each increment and allowing full primary consolidation under each load before applying the next. The vertical strain at each load increment is measured, allowing the compression curve (void ratio against effective vertical stress) to be plotted, from which the compression index (Cc), the recompression index (Cr), and the preconsolidation pressure (the maximum stress the soil has experienced in its geological history) are determined.
The oedometer test also provides the coefficient of consolidation (cv) and the coefficient of volume compressibility (mv), which govern the rate and magnitude of consolidation settlement under applied load. These parameters are essential for predicting the settlement of foundations and embankments on compressible clays, and for designing ground improvement schemes that use vertical drains to accelerate consolidation. The distinction between normally consolidated and overconsolidated clay — which profoundly affects both compressibility and strength — is determined from the oedometer test, since the preconsolidation pressure identifies the stress level at which the soil transitions from lightly to heavily overconsolidated behaviour. The oedometer is a standard and essential test for any project involving significant loading of soft or medium clays.

CBR
The California Bearing Ratio (CBR) test was developed in the late 1930s by the California Division of Highways as an empirical measure of the bearing capacity of pavement subgrade and sub-base materials, and it remains one of the most widely used tests in highway and airfield pavement design. The test measures the resistance of a compacted soil or granular material to the penetration of a standard cylindrical plunger at a controlled rate of penetration. The force required to achieve specified penetrations (2.5 mm and 5 mm) is compared to the force required to achieve the same penetrations in a standard crushed rock material, and the ratio, expressed as a percentage, is the CBR value.
CBR values range from less than 1% for very soft, compressible subgrades (such as peat or very soft clay) to more than 100% for well-graded granular materials (where the material is stronger than the standard reference material). In UK pavement design, subgrade CBR is the primary input to pavement thickness design using the methods in Manual of Contract Documents for Highway Works (MCHW) Volume 7 or the DMRB. The design CBR is the equilibrium CBR — the long-term, water-soaked value that represents the worst-case condition for the pavement subgrade. For cohesive subgrades, design CBR can be estimated from plasticity index and moisture content using published correlations, which allows design to proceed without extensive CBR testing where classification data are available. CBR testing is also used in the specification and acceptance of compacted fill materials and sub-bases.
Permeability
Permeability — more precisely, hydraulic conductivity — is a measure of the ease with which water flows through a soil or rock under a hydraulic gradient. It is one of the most important and most variable geotechnical parameters: permeability values for natural soils range over more than ten orders of magnitude, from approximately 10⁻¹ m/s for clean gravels to less than 10⁻¹⁰ m/s for intact clays. This enormous range means that permeability has a fundamental influence on drainage, consolidation rates, groundwater flow, dewatering requirements, and the feasibility and cost of many construction operations.
Laboratory permeability tests are carried out using either the constant head method (for coarser-grained, more permeable soils) or the falling head method (for finer-grained, less permeable soils). In the constant head test, a steady flow of water is maintained through the specimen under a constant hydraulic head differential, and the flow rate is measured to calculate permeability using Darcy’s Law. In the falling head test, the water level in a standpipe above the specimen is allowed to fall and the rate of fall is used to calculate permeability. For very low permeability soils, the coefficient of consolidation from the oedometer test can be used to back-calculate permeability indirectly, as the two are related through the compressibility.
It is important to recognise that laboratory permeability tests measure the permeability of a small, intact specimen, which may not be representative of the bulk permeability of the soil mass in the field. Many soils have permeabilities that are strongly anisotropic — higher in the horizontal direction than the vertical, due to the alignment of particles and the presence of thin, more permeable layers within the soil fabric — and many have macro-scale features such as fissures, sand lenses, root holes, and animal burrows that dominate bulk permeability but are absent from the small laboratory specimen. For this reason, field permeability tests — pumping tests, rising and falling head tests in boreholes, and packer tests in rock — are generally more reliable than laboratory tests for determining the bulk hydraulic conductivity of natural deposits. Laboratory and field data should always be considered together and any significant discrepancies investigated.


Leave a Reply