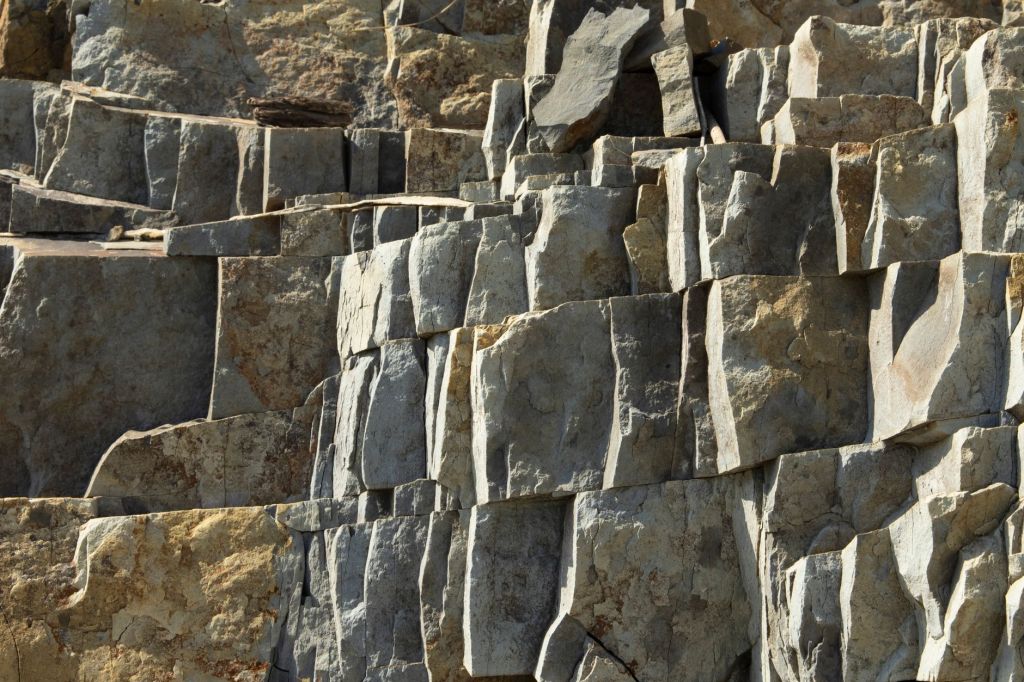

The intact rock material recovered in a borehole core tells only part of the story. In engineering practice, it is the rock mass — the combination of intact rock and the network of discontinuities that divide it — that governs the behaviour of foundations, tunnels, slopes, and underground excavations. The intact rock may be strong, but a rock mass cut by closely spaced, clay-filled joints can be weak, deformable, and unstable. To translate the observations made during rock logging into a form that engineers can use for design, a series of rock mass classification systems have been developed, each providing a numerical index that summarises the quality of the rock mass in a single value. Understanding how these systems work, what they measure, and when to use them is essential for anyone involved in geotechnical practice in rock.
Rock mass classification systems do not replace geological judgement or engineering analysis — they summarise and communicate it. A rock mass classification index derived from borehole logging and geological mapping provides a basis for comparing conditions at different locations, for preliminary design of support systems in tunnels and excavations, for estimating geomechanical parameters, and for communicating ground conditions to other members of the project team. The four systems most widely used in UK and international practice are Rock Quality Designation (RQD), Rock Mass Rating (RMR), the Q-system, and the Geological Strength Index (GSI).
Rock Quality Designation (RQD)
Rock Quality Designation is the simplest and most widely used rock quality index, and is a prerequisite for all the more complex classification systems. It was developed by Deere in 1963 and remains, over sixty years later, one of the most important pieces of data derived from borehole logging. RQD is defined as the cumulative length of core pieces greater than or equal to 100 mm in length, expressed as a percentage of the total core run length. Only natural fractures — joints, faults, bedding planes, and other geological discontinuities — are counted; drilling-induced breaks are excluded. The distinction between natural and induced fractures is therefore crucial to an accurate RQD determination, and it requires careful examination of the core and honest judgement on the part of the logger.
RQD values range from 0% (extremely poor quality, very closely fractured rock) to 100% (excellent quality, intact or widely spaced fractures). The qualitative descriptions associated with different RQD ranges are: 0–25% Very poor; 25–50% Poor; 50–75% Fair; 75–90% Good; 90–100% Excellent. These descriptors are widely used in geotechnical reports as a shorthand for rock quality, but the numerical value of RQD is what feeds into the more complex classification systems and should always be reported alongside the qualitative description.
RQD has important limitations that must be understood when interpreting it. First, it is sensitive to the orientation of the borehole relative to the dominant discontinuity sets: a borehole drilled perpendicular to the main joint set will produce a much lower RQD than one drilled parallel to it, even in the same rock mass. Second, it is insensitive to the character of discontinuities — a rock mass with closely spaced, tight, rough, unfilled joints may have a low RQD but be mechanically competent, whilst one with widely spaced joints filled with soft clay may have a high RQD but be weak along those joints. These limitations mean that RQD should always be considered alongside a full description of discontinuity character, and should not be used in isolation as the sole indicator of rock mass quality.

Rock Mass Rating (RMR)
The Rock Mass Rating system was developed by Bieniawski in 1973 and has been revised several times since, with the 1989 version being the most widely used in current practice. RMR provides a comprehensive assessment of rock mass quality by summing rating values assigned to six parameters: the uniaxial compressive strength of intact rock; RQD; discontinuity spacing; discontinuity condition (including roughness, persistence, aperture, infill, and weathering); groundwater conditions; and a correction for discontinuity orientation relative to the excavation direction. Each parameter is assessed against defined rating tables, and the ratings are summed to give a total RMR value between 0 and 100.
RMR values are divided into five rock mass classes: Class I (RMR 81–100) Very good rock; Class II (RMR 61–80) Good rock; Class III (RMR 41–60) Fair rock; Class IV (RMR 21–40) Poor rock; Class V (RMR 0–20) Very poor rock. Each class is associated with guidance on stand-up time and unsupported span for tunnels, on excavation methods, and on the likely behaviour of the rock mass. The RMR system was originally developed for tunnelling applications and has been most widely validated in that context, but it is also used in slope stability assessment, foundation design, and the estimation of rock mass strength parameters.
The great strength of RMR is that it explicitly incorporates both the characteristics of the intact rock and the character of the discontinuities, including their orientation relative to the excavation, in a single index. It is also directly linked to empirical design charts for tunnel support and to the Hoek-Brown failure criterion through the Geological Strength Index. However, RMR has been criticised for the subjectivity involved in rating discontinuity conditions, for the relatively coarse rating intervals that can lead to significant differences in final RMR for minor differences in input, and for its limited applicability in very poor quality rock masses where the rating values approach zero. It is also sensitive to the experience of the practitioner applying it, and inter-user variability can be significant.
Q-System
The Q-system was developed by Barton, Lien, and Lunde at the Norwegian Geotechnical Institute in 1974, based on a database of case histories from tunnels in Scandinavia. It has since been updated and expanded to incorporate a much larger dataset and has become one of the most widely used rock mass classification systems in the world, particularly for tunnelling and underground excavation design. The Q-value is calculated from the product and ratio of three pairs of parameters: RQD divided by Jn (joint set number); Jr (joint roughness number) divided by Ja (joint alteration number); and Jw (joint water reduction factor) divided by SRF (stress reduction factor).
Each of these three ratios has a physical interpretation. RQD/Jn represents the block size — the overall structure of the rock mass. Jr/Ja represents the inter-block friction angle — the shear strength of the critical discontinuities. Jw/SRF represents the active stress — the influence of water pressure and in-situ stresses on the effective strength of the rock mass. The Q-value ranges over approximately six orders of magnitude, from 0.001 (exceptionally poor) to 1000 (exceptionally good), which makes it sensitive over a much wider range of rock mass conditions than RMR. Q-values are grouped into nine categories from Exceptionally poor through to Exceptionally good, each associated with guidance on tunnel support requirements.
The Q-system has a strong empirical basis and has been calibrated against thousands of tunnel case histories, giving it high credibility for tunnel support design in competent to moderately fractured rock. The Qc system (Q normalised by compressive strength) extends its applicability to very weak or very strong rocks. However, the Q-system is more complex to apply than RMR, requiring the assignment of values to six separate parameters, and the rating of parameters such as SRF (which accounts for the effects of in-situ stress, squeezing, and swelling) can be highly subjective, particularly in the absence of stress measurements. Like RMR, it should be applied by experienced practitioners and its results validated against engineering judgement and site-specific data.
Geological Strength Index (GSI)
The Geological Strength Index was introduced by Hoek, Kaiser, and Bawden in 1995 as a way of linking geological observations directly to the Hoek-Brown failure criterion for rock masses. Unlike RMR and Q, which are based on rating tables applied to specific parameter measurements, GSI is estimated directly from a qualitative description of the rock mass structure (the degree of interlocking of rock blocks) and the condition of its discontinuity surfaces (their roughness, degree of weathering, and nature of any infill). The two parameters are entered on a chart and a GSI value read off, representing the geological strength index of the rock mass.
GSI values range from approximately 10 (for heavily sheared, weathered, or tectonically disturbed rock masses) to 100 (for intact or massive rock). The value is used, together with the intact rock strength and the Hoek-Brown material constant mi, to calculate the parameters of the Hoek-Brown failure criterion for the rock mass: the rock mass compressive strength, the tensile strength, and the deformation modulus. These parameters can then be used directly in numerical modelling or converted to equivalent Mohr-Coulomb parameters (cohesion and friction angle) for use in conventional limit equilibrium analysis.
A significant advantage of GSI is that it can be estimated from rock mass exposures as well as from borehole core, and it is particularly well suited to use where large, complex, or heavily deformed rock masses need to be characterised. The qualitative nature of the assessment means that it requires significant geological experience and judgement, but Hoek and others have published detailed guidance charts for its application to different rock mass types, including foliated metamorphic rocks, molassic sequences, and flysch. GSI has become the dominant rock mass classification system for the application of the Hoek-Brown criterion in rock engineering, and its use is standard practice in UK tunnelling and slope stability design.
When Each System is Used
The choice of which rock mass classification system to use depends on the purpose of the assessment, the stage of the project, and the nature of the rock mass being characterised. RQD is universally used — it is derived from borehole logging as a matter of routine and feeds into all the more complex systems, so it should always be calculated and reported. It provides a rapid, quantitative indicator of fracture intensity that is useful at all project stages, from preliminary assessment through to detailed design.
RMR is most commonly used in the preliminary and detailed design of tunnels and underground excavations, particularly in good to fair quality rock masses where its rating system is well calibrated. It is also widely used in slope stability assessment and in the derivation of rock mass properties for foundation design. The 1989 version of RMR is the standard for most UK applications, though the updated RMR14 system addresses some of the shortcomings of the earlier version. RMR is typically reported in ground investigation reports for infrastructure projects where underground works are anticipated.
The Q-system is most widely used in Scandinavia and in projects following the Norwegian Method of Tunnelling (NMT), but is also commonly applied in UK tunnel design. It is particularly valuable for the design of rock bolt and shotcrete support systems in tunnels and caverns, where its empirical database of case histories provides directly applicable design guidance. The Q-system is generally considered to be more reliable than RMR in poor quality rock masses and in squeezing or swelling conditions where SRF plays a dominant role.
GSI is the preferred classification system when rock mass properties are required as inputs to the Hoek-Brown failure criterion, which is the standard approach for numerical modelling of rock masses in UK practice. It is used at the detailed design stage, particularly for tunnels, deep excavations, and slopes in complex or heavily deformed rock masses. Where RMR or Q data are available from earlier stages of a project, they can be converted to approximate GSI values using published correlations, providing a link between the empirical classification systems and the constitutive modelling approach.


Leave a Reply